
Data Center Chiller Setpoint Optimization Using AI and Physics-Based Simulation


We gave the agentic AI assistant three parametric simulations of a 1 MW data center cooling plant and asked it to find the chiller setpoint that would cut energy use without breaching thermal safety limits. Here’s how it caught a problem the numbers alone would have missed.
Every data center cooling plant with a waterside economizer faces the same trade-off: raise the chiller setpoint and the economizer picks up more of the load, cutting compressor run-time and improving power usage effectiveness (PUE). Push it too far, though, and thermal margins erode in ways that are not obvious from a single simulation run. For a 1 MW AI data center reference model built in Modelon Impact using our Data Center Library, we used the software’s AI Assistant to optimize the chiller setpoint temperature for better PUE.
The Model: A 1 MW AI Data Center Cooling Plant
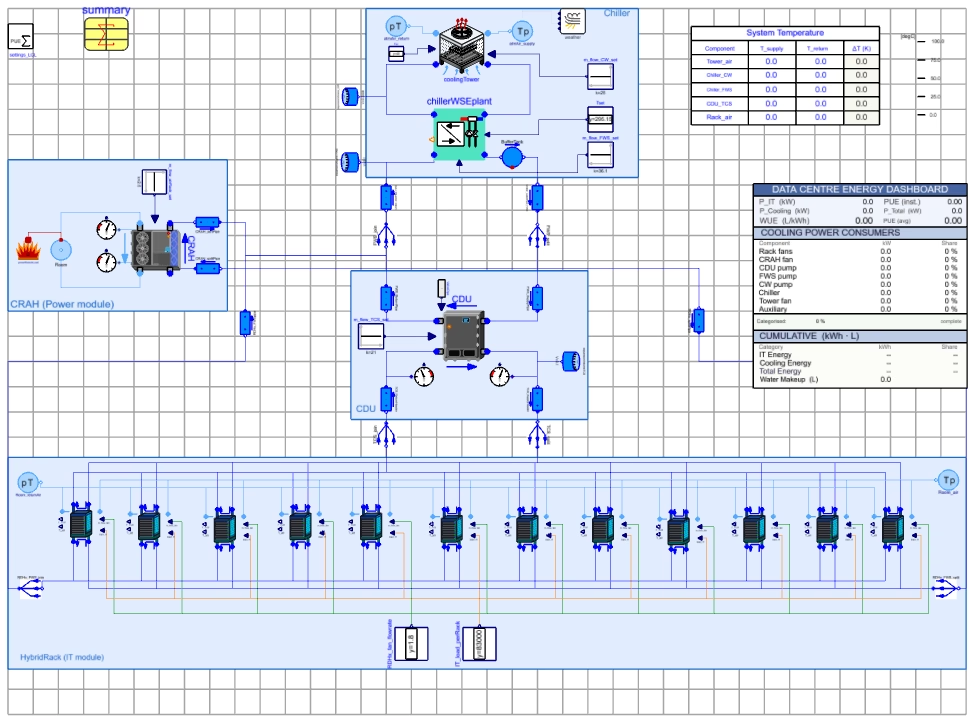
The model is a system-level representation of a 1 MW IT load facility based on the Schneider Electric EcoStruxure Modular Data Centre AI Reference Design (RD48DSR0_EN), shown in Figure 1. The model contains three nested fluid loops:
- Condenser water (CW) loop — facility water through the cooling tower and into the chiller/water-side economizer (WSE) plant
- Facility water supply (FWS) loop — propylene-glycol/water mixture produced by the chiller plant, split three ways to the CDU (26.3 kg/s), twelve RDHx rear-door heat exchangers (6.5 kg/s), and the computer room air handler (CRAH) unit (3.3 kg/s)
- Technical cooling supply (TCS) loop — ethylene-glycol/water mixture from the cooling distribution unit (CDU) to all twelve rack manifold inlets
The chiller plant includes a waterside economizer (WSE) with a supervisory mode controller. Depending on ambient conditions and the FWS supply setpoint, the plant transitions between three operating modes:
| Mode | Description |
|---|---|
| FC — Free Cooling | WSE only; compressor off |
| PMC — Partial Mechanical Cooling | WSE and chiller in parallel |
| FMC — Full Mechanical Cooling | Chiller only; WSE bypassed |
Each mode switch enforces a minimum 10-minute dwell time to avoid hunting. The model is driven by Berlin TMY (Typical Meteorological Year) weather data, giving a realistic European ambient temperature profile across a full 24-hour simulation.
All twelve racks are HybridWithRDHx instances, each with an 83 kW IT load: 80% is rejected through the TCS/CDU liquid loop and 20% through rack exhaust air to the rear-door heat exchanger. The system summary continuously records PUE, chiller COP, cooling mode, and rack thermal state throughout the run.
Setting Up the Chiller Setpoint Experiment
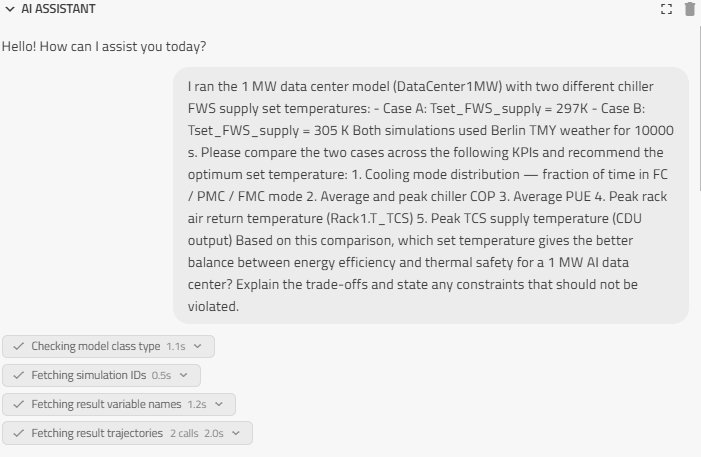
The key parameter is the chiller outlet temperature setpoint for the facility water supply loop. The reference design targets 295.15 K (22 °C). But operating at a higher setpoint would allow the WSE to satisfy more of the cooling load, reducing compressor runtime and improving PUE. We ran two experiments with the help of the AI assistant to find the optimal setpoint. The first comparison pitted Case A (297 K) against Case B (305 K), both using Berlin TMY weather over 10,000 seconds. The prompt that kicked off the comparison is shown in Figure 2.
Case A vs. Case B: What the AI Assistant Found
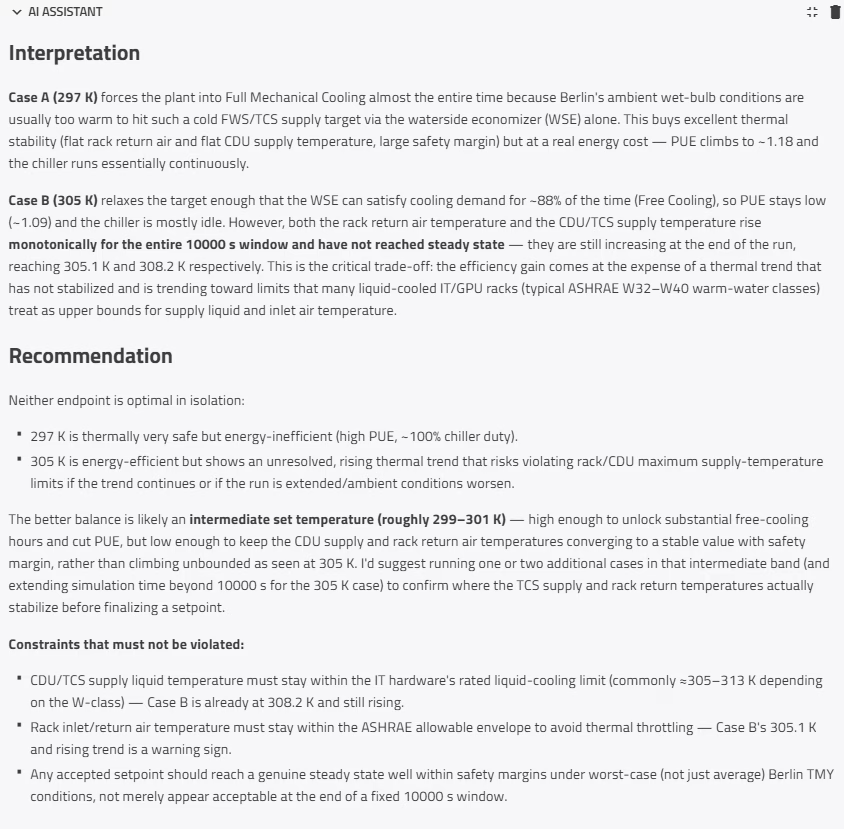
The AI Assistant retrieved the simulated results for the interpretations. Fig. 3 shows the assistant interpreting the results and giving recommendations. Because the Modelon Impact AI assistant supports an agentic workflow, it can run the simulations itself from its own suggested values, or the engineer can edit the model and run them manually. For this case, we ran the model manually using the assistant’s recommended chiller setpoint temperature.
Testing the AI Assistant’s Recommendation: 300K
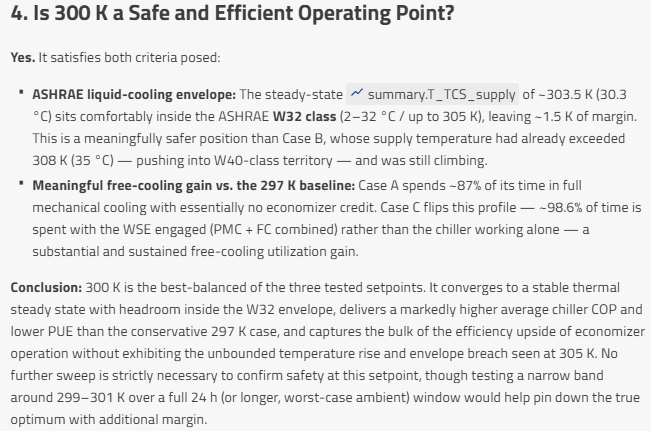
Following the AI Assistant’s recommendation, we ran a third case at 300 K and let the assistant analyze the result. Fig. 4 shows a snapshot of the assistant’s reply after analyzing the simulated results.
The steady-state TCS supply settles at about 303.5 K (30.3 °C), comfortably inside the ASHRAE W32 envelope (2–32 °C, up to 305 K), with roughly 1.5 K of margin to spare. The plant spends about 98.6% of its time with the waterside economizer engaged (combined PMC and FC), versus Case A’s 87% Full Mechanical Cooling. That combination delivers a higher average chiller COP and a lower PUE than the conservative 297 K case, without the unbounded temperature rise and envelope breach seen at 305 K.
What This Means for Your Data Center Cooling Plant
The exact numbers here are specific to this model, plant configuration, and Berlin weather file. Another site, IT load, or fluid loop sizing would shift the optimal setpoint. What generalizes is the workflow: run parametric cases, let an AI assistant read the KPIs the way an engineer would, and catch a thermal trend before it becomes a real problem, not after.
That combination, Modelon Impact’s physics-based simulation plus an AI assistant that can compare cases and flag what matters, turns a data dump into actionable engineering guidance instead of leaving an engineer to eyeball a stack of plots. It also shortens the timeline: setting up the cases, running them, and interpreting the results took a couple of hours with the assistant, versus a day or more of manual configuration and plot reading.
The question was never which setpoint produces the best-looking PUE in isolation. It’s the setpoint that produces a stable, thermally safe operating point while still capturing most of the available efficiency gain. For this 1 MW AI data center reference model, that answer is 300 K: a PUE close to Case B’s efficiency with none of its risk. If you’re sizing cooling for a new or existing data center, the same AI-assisted workflow can pinpoint your optimal setpoint in an afternoon rather than after a week of manual runs. See the Data Center Library link below to try it on your own model.
See how reference designs like this one come together in the Data Center Library for Modelon Impact.